Chelsea vs Manchester United Match Stats: October 31, 2026
Compare verified Chelsea vs Manchester United stats from Oct. 31, 2026: possession, shots on target, passing, corners and red-card context.
Chelsea vs Manchester United Match Stats: October 31, 2026
PREMIER LEAGUE | OCTOBER 31, 2026 | STAMFORD BRIDGE
Chelsea’s 2-0 Premier League win over Manchester United on October 31, 2026 can be viewed beyond the goals through a full-time team comparison. Manchester United’s official match centre records Chelsea with 59% possession and nine shots on target, compared with United’s 41% and five. The same feed lists eight Chelsea corners and seven for United. These are full-match figures, not separate first-half numbers or an average of past meetings.
Chelsea vs Manchester United match stats — October 31, 2026
| Full-time measure | Chelsea | Manchester United |
| Possession | 59% | 41% |
| Shots on target | 9 | 5 |
| Shots off target | 6 | 4 |
| Blocked shots | 3 | 3 |
| Big chances | 2 | 2 |
| Total passes | 542 | 379 |
| Completed passes | 479 | 293 |
| Tackles | 15 | 15 |
| Duels won | 56 | 42 |
| Corners | 8 | 7 |
| Offsides | 3 | 2 |
| Fouls | 8 | 20 |
| Yellow cards | 1 | 4 |
| Red cards | 0 | 1 |
Data scope: The table reproduces categories published in Manchester United’s official October 31 match centre. Some third-party providers use different tracking methods and display different possession or shot figures. Do not combine one provider’s possession with another provider’s total shots and call that a single verified dataset. The official page also displayed an obviously malformed passing-accuracy field, so that field is intentionally omitted here.
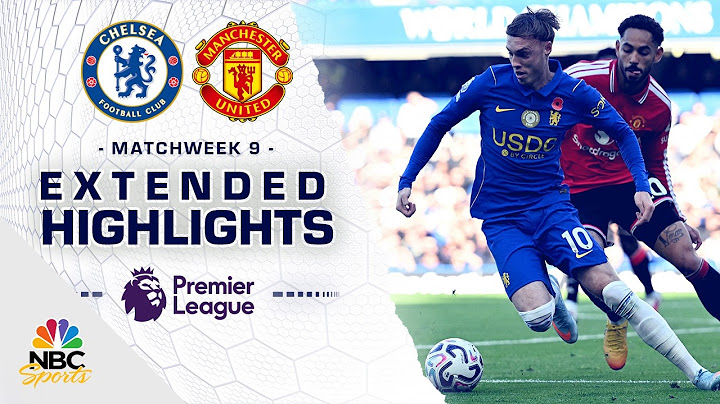
Possession and passing: how much of the game did Chelsea control?
Chelsea’s 59% possession indicates that the home team had a larger share of recorded ball control over the full contest. The passing figures point in the same direction: Chelsea attempted 542 passes and completed 479, against 379 attempts and 293 completions for Manchester United. Those figures describe the match in aggregate; they cannot tell us that Chelsea dominated every stretch of play or exactly what the possession split was before the red card.
The 2-0 scoreline and red-card timing make the distinction particularly useful. United created first-half chances and Chelsea took the lead just after halftime. Martínez was then sent off in the 63rd minute, leaving United with ten players for the remainder of the match. That game-state shift could affect how the teams circulated the ball, but the published full-time totals do not let us isolate how many passes each side made in each phase.
Completed passes and total passes are also separate metrics. A pass attempt is counted whether or not it reaches a teammate; completed passes are the successful subset. Comparing 542 with 479, or 379 with 293, is reasonable, but readers should not treat the site’s malformed “8%” passing-accuracy display as real match data.
Shots on target and chances: why Chelsea scored twice
The official match centre credits Chelsea with nine shots on target and United with five. Chelsea also recorded six off-target attempts, while United had four. Both teams were credited with two big chances. That is an important reminder that a team can generate dangerous attacks without turning them into goals. The numbers alone cannot reconstruct every opportunity or explain a goalkeeper’s save difficulty.
The decisive shots belonged to Morgan Rogers and Cole Palmer. Rogers finished a move started when Roméo Lavia recovered the ball in midfield in the 50th minute; Palmer later converted a penalty awarded after a reviewed incident involving Martínez and Wesley Fofana. United had earlier seen Matheus Cunha’s apparent goal disallowed for offside, while Chelsea had Estêvão efforts overturned. Disallowed goals must not be counted in the final score or added to a list of credited scorers.
Be careful with shorthand such as “Chelsea had 18 shots.” The source used here provides on-target, off-target and blocked categories; those subdivisions can differ in definition across feeds. This article keeps the reported categories visible rather than presenting a newly assembled total as an independently verified statistic. Likewise, the two “big chance” values are feed-defined labels, not guarantees that a particular opportunity should have been scored.
Corners, offsides and defensive contests
The corner count was close: Chelsea eight, Manchester United seven. A one-corner gap does not, by itself, settle which team attacked better. Corners can result from crosses, blocked shots or saves, and some lead to no effort at goal. In this contest, a Chelsea corner was associated with the reviewed penalty incident, demonstrating why the detail of a set play can matter more than the total number awarded.
Chelsea were flagged offside three times and Manchester United twice in the official summary. More significant for the story of the match were the goal reversals: both teams had apparent goals ruled out during the first half. Those incidents illustrate how the law’s application can materially change a score without ever appearing as a credited shot converted into a goal.
The defensive columns offer another contrast. Both teams recorded 15 tackles, while Chelsea won 56 duels to United’s 42. The equality in tackles does not mean that the teams defended equally well; the nature, timing and location of a challenge all matter. A duel-won count also depends on how the provider defines contested situations, so it is most useful as a within-feed comparison.
Fouls and cards: the biggest disciplinary gap
Chelsea committed eight fouls according to the official match centre; Manchester United committed 20. Chelsea received one yellow card, compared with four for United, and the visitors had the match’s only red card. Martínez received a second yellow after the referee reviewed contact with Fofana inside United’s box. Palmer scored from the penalty that followed.
The timing is key to interpreting those statistics. United were a goal behind when the dismissal occurred and then immediately went two behind. The full-time foul and disciplinary totals show a more heavily penalized United side, but they should not be treated as a substitute for watching individual refereeing decisions or for judging whether every challenge was equally serious.
What these figures tell us—and what they cannot prove
The official full-time data show Chelsea ahead in possession, shots on target, completed passes and duels won.
Both teams registered two big chances in the match-centre feed, so the score is not a direct measurement of every opening.
United had more fouls and bookings, plus the only dismissal; those facts help explain the pressure of the final half-hour.
The figures do not establish a minute-by-minute tactical story or a season-long strength ranking. Those require different data and separate analysis.
Related match coverage
To read what happened in sequence, start with our Chelsea 2-0 Manchester United result and match recap. For a different question, see confirmed Chelsea and Manchester United starting lineups.
Frequently asked questions
Who had more possession in Chelsea vs Manchester United?
Chelsea held 59% possession to Manchester United’s 41%, according to United’s official October 31 match centre.
How many shots on target did each team have?
Chelsea recorded nine shots on target and Manchester United recorded five in the same official dataset.
How many corners were there?
Chelsea took eight corners and Manchester United took seven.
How many red cards were shown?
One. Manchester United defender Lisandro Martínez was dismissed after a second yellow card in the 63rd minute.
Why do some websites show different shot or possession totals?
Providers can apply different event definitions and corrections. To avoid mixing incompatible counts, this article uses one named official match-centre feed for its entire statistics table.