Labor Force Participation Rate: Formula and Interpretation
Learn the labor force participation rate formula, who is counted and why this measure tells a different story from the unemployment rate.
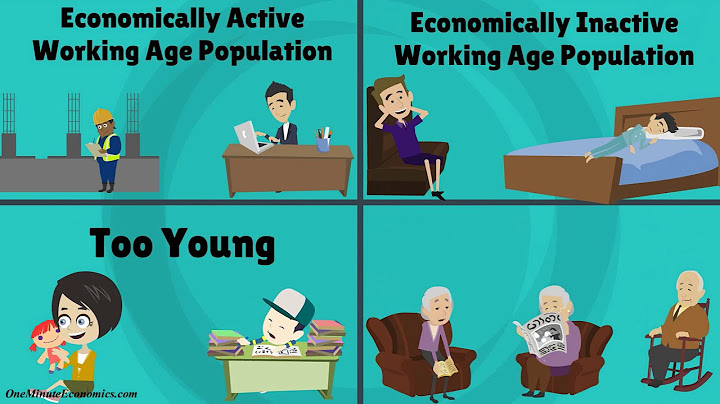
The labor force participation rate (LFPR) measures the proportion of the working‑age population that is either employed or actively seeking employment. Unlike the unemployment rate, which only looks at those who are jobless and looking, the LFPR captures the broader health of the labor market by indicating how many people are engaged in the workforce. Understanding the LFPR is essential for interpreting economic reports, assessing demographic shifts, and evaluating policy impacts on employment.
What labor force participation means
Labor force participation is defined by the U.S. Bureau of Labor Statistics as the sum of employed persons and unemployed persons who are actively seeking work, divided by the total population aged 16 and older, excluding those in institutions and the armed forces. The resulting percentage reflects the share of the working‑age population that is willing and able to work. A high participation rate suggests that a large portion of the population is engaged in the labor market, while a low rate may signal discouragement, retirement, or demographic changes such as aging. Importantly, the participation rate is a structural indicator: it does not fluctuate with short‑term job openings or seasonal hiring but rather tracks long‑term labor market trends. For example, the LFPR fell from 63.5% in 2019 to 62.3% in 2020, largely due to the pandemic’s impact on the willingness of some workers to seek employment. Understanding this metric helps analysts distinguish between a shrinking labor pool and a temporary dip in job availability.
How to calculate the participation rate
The formula for the labor force participation rate is straightforward: **LFPR = (Employed + Unemployed actively seeking work) ÷ Total working‑age population × 100%**. 1. **Employed**: Individuals who performed any work for pay or profit during the reference week. 2. **Unemployed**: Individuals who did not work during the reference week, were available for work, and had actively sought employment in the past four weeks. 3. **Total working‑age population**: All persons aged 16 and older, excluding those in institutions, the armed forces, and those not in the labor force. Using the U.S. Current Population Survey data, if 160 million people are employed and 8 million are unemployed and actively seeking work, and the working‑age population is 260 million, the calculation would be: (160 + 8) ÷ 260 × 100 = 68.5%. This percentage is reported monthly by the BLS and is a key input for the Federal Reserve’s assessment of economic health. It is distinct from the unemployment rate, which is calculated as unemployed divided by the labor force (employed + unemployed). The LFPR therefore provides a broader view of labor market participation beyond the narrow scope of unemployment statistics.
Who is excluded from the labor force
The labor force participation rate (LFPR) counts only those who are either employed or actively seeking employment. Individuals who are not part of this group are excluded for specific reasons. First, people who are permanently or temporarily unable to work—such as those with serious health conditions or disabilities that prevent them from working—are not counted. Second, students who are not seeking work and are not employed are excluded unless they are also looking for jobs. Third, discouraged workers—those who have stopped looking for work because they believe no jobs are available—are omitted because they are not actively seeking employment. Fourth, retirees who are not looking for work and are not employed are excluded. Finally, people who are in the military or in certain institutional settings (e.g., prisons) are not considered part of the civilian labor force. These exclusions mean that the LFPR reflects only the segment of the population that is available and willing to work, not the entire working-age population.
Why participation can move without unemployment moving
The LFPR and the unemployment rate measure different aspects of the labor market, so changes in one do not always coincide with changes in the other. The unemployment rate is the ratio of unemployed persons actively seeking work to the total labor force. If the labor force shrinks because more people leave the workforce—such as retirees or discouraged workers—while the number of unemployed remains constant, the unemployment rate can stay flat or even rise because the denominator has decreased. Conversely, if more people join the labor force by starting to look for work, the unemployment rate may fall even if the absolute number of unemployed does not change, because the denominator has increased. Additionally, economic conditions that affect the willingness to work—like a recession that discourages job seekers—can reduce the LFPR without affecting the unemployment rate if those who leave the workforce were previously counted as unemployed. Thus, shifts in participation reflect broader demographic and behavioral changes, whereas the unemployment rate focuses narrowly on joblessness among those already engaged in the labor market.
Demographics and long-term trends affecting the rate
The labor force participation rate (LFPR) reflects the share of the civilian noninstitutional population aged 16 and older that is either employed or actively seeking work. Demographic shifts—particularly aging—have a pronounced effect. As the Baby Boomer cohort moves into retirement age, the proportion of older adults who are no longer working rises, pulling the overall LFPR downward. Conversely, the influx of younger workers, many of whom are still in school or early in their careers, can temporarily elevate the rate if they enter the labor market in large numbers. Immigration also plays a role; new entrants often have higher participation rates than the native-born population, especially when they are younger and more economically active. Additionally, changes in societal attitudes toward work, such as increased participation of women in the workforce, have historically boosted the LFPR. However, economic downturns can reverse these gains as discouraged workers exit the labor force, further depressing the rate. Understanding these demographic forces is essential for interpreting LFPR trends and distinguishing them from short‑term labor market fluctuations.
Where to check and interpret the latest BLS series
The U.S. Bureau of Labor Statistics publishes the LFPR in its monthly Current Population Survey (CPS) series, specifically series A-1.0 for the overall rate and A-1.1 for the male and female breakdowns. These data are released on the first Friday of each month and are available in both raw and seasonally adjusted forms. To access the most recent figures, visit the BLS website and navigate to the “Labor Force Statistics” section, selecting the “Labor Force Participation Rate” series. The data tables include year‑over‑year and month‑to‑month changes, allowing analysts to assess whether shifts are part of a longer trend or a temporary blip. For deeper analysis, the BLS also provides cross‑tabulations by age, education, and ethnicity, which help explain underlying demographic influences. When interpreting the series, remember that the LFPR is a ratio of the labor force to the civilian population; thus, changes in either numerator or denominator can affect the rate.
